Read our latest forecasts for investment returns and our region-by-region economic outlook.

.
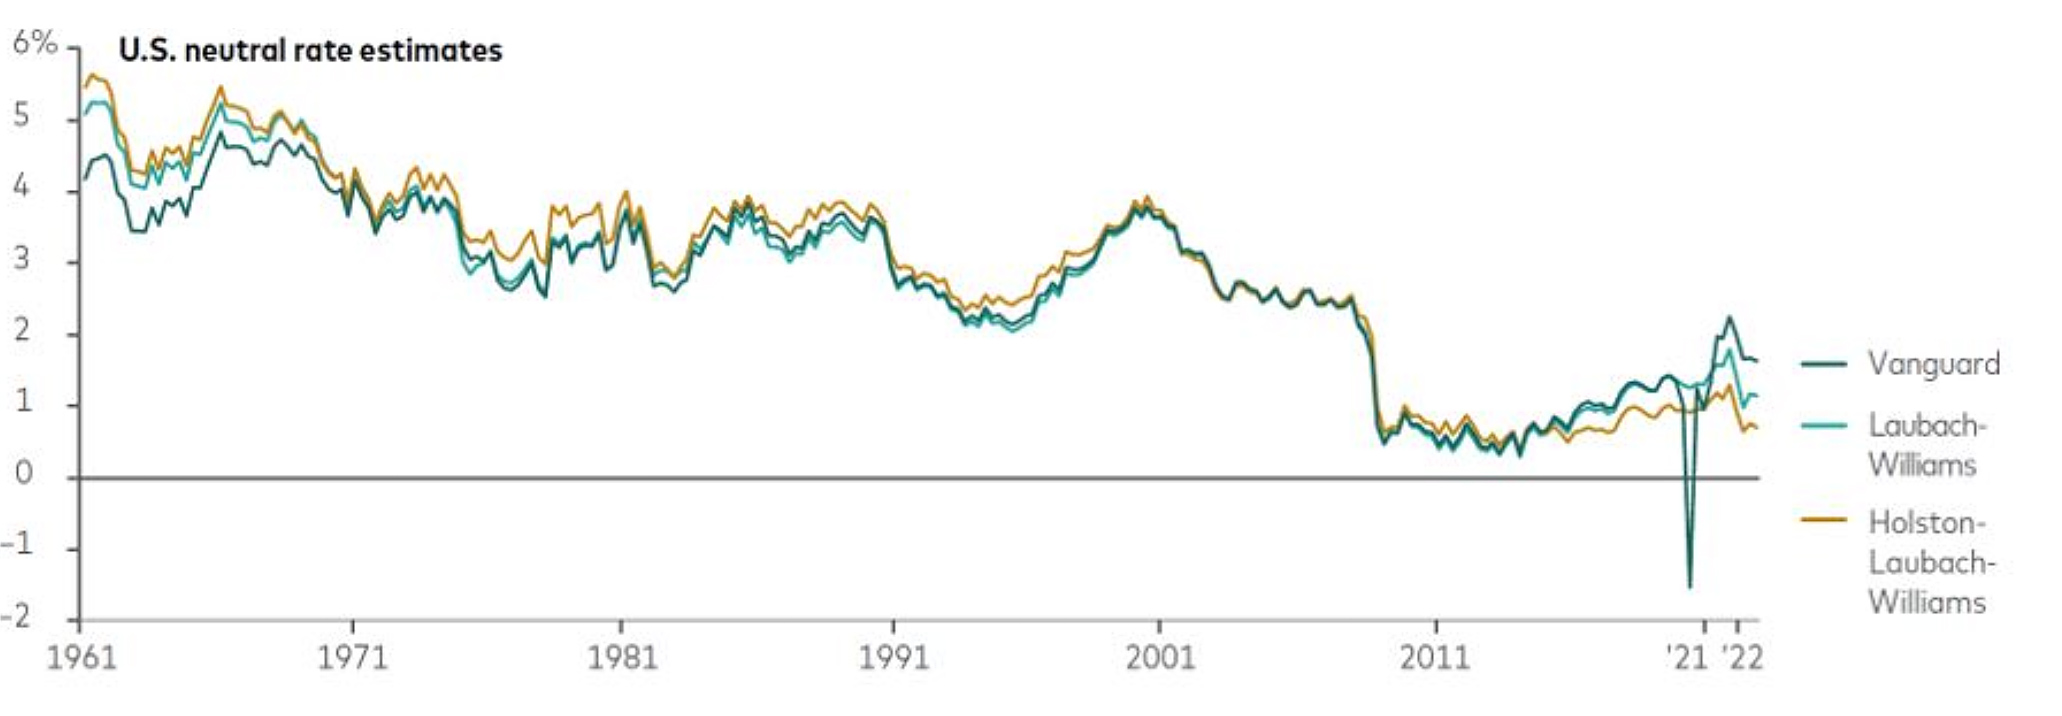
The neutral rate of interest in the United States may be higher than many people think—including Federal Reserve policymakers. That is among the findings of new Vanguard research that suggests current monetary policy may be less restrictive than generally assumed. Demographics began to push the neutral rate higher before the COVID-19 pandemic, the research finds, and fiscal deficits have accelerated the rise since.
The dividing line between tight and loose monetary policy may be higher than policymakers think
Notes: The Laubach-Williams and Holston-Laubach-Williams estimates of the U.S. neutral rate of interest are derived from Federal Reserve Bank of New York models. The Vanguard estimate is based on 2023 research by Joseph H. Davis, Ryan Zalla, Joana Rocha, and Josh Hirt.
Sources: Vanguard and Federal Reserve Bank of New York model estimates of the neutral rate through 2022.
The neutral rate is the theoretical central bank interest rate target that would neither restrict nor fuel activity in an economy at full employment. Assessments of the neutral rate, also known as R-star, are essential to policy-setting.
Vanguard’s neutral-rate estimate is about half a percentage point higher than the estimate produced by the Laubach-Williams model, the Fed’s most frequently cited neutral rate source, named for its economist authors. We ran our higher neutral-rate assessment through the Fed’s macroeconomic model under a range of monetary policy rules. The results suggested that the median effective rate target would peak at 6% in 2023. The Fed’s current rate target is 5%–5.25%.
In the longer term, the median central bank target rate would need to settle at 3.5%, or a full percentage point higher than the median long-run outlook in the Fed’s most recent Summary of Economic Projections. These “higher for longer” findings support the idea put forth by Joe Davis, Vanguard’s global chief economist, in his January Wall Street Journal commentary suggesting that long-term investors stand to benefit from a new era of “sound money.”
The views below are those of the global economics and markets team of Vanguard Investment Strategy Group as of July 19, 2023.
Region-by-region outlook
Australia
A change at the top is unlikely to significantly alter the policy approach of the Reserve Bank of Australia (RBA). The government announced on July 14 that Michele Bullock would replace Philip Lowe as governor when Lowe’s seven-year term expires on September 18.
We’re watching developments related to interest-rate targeting as potentially more significant than the leadership change. A recent recommendation of an external review of the RBA would clarify the bank’s inflation target as the midpoint of the current 2%–3% range. “Assuming this recommendation is implemented in 2024, as widely expected, this adds a hawkish tilt to RBA policy so long as inflation remains above target,” said Alexis Gray, a Vanguard senior economist.
While the RBA left its cash rate target unchanged at 4.1% on July 4, we expect above-target inflation to spur the central bank to raise its cash rate target to 4.6% and leave it there at least until 2024.
Headline inflation registered its smallest increase in 13 months in May, up 5.6% compared with a year earlier. Excluding food, automotive fuel, and holiday travel, prices were 6.4% higher in May. We expect headline inflation to fall to around 4.5% by year-end, as higher interest rates dampen demand, and to reach the RBA’s 2%–3% target in late 2024 or 2025.
We continue to expect economic growth of 1%–1.5% for all of 2023, though risks skew to the downside. Our proprietary leading indicators model suggests that growth will fall below trend in the coming quarters amid weak consumer confidence and subdued consumption. We assign about a 40% probability of recession over the next 12 months.
United States
The most recent inflation and labor reports suggest some cooling in the economy ahead of a July 26 monetary policy announcement by the Federal Reserve.
The Consumer Price Index rose 3% on a year-over-year basis in June, down from 4% in May. Core prices, which exclude food and energy, were 4.8% higher, down from 5.3% the month before. However, the path to the Fed’s 2% inflation target is likely to be long and winding. We expect year-over-year core inflation to finish 2023 around 3.3%, and that it will not fall below 2% until 2025.
Employers added 209,000 jobs in June, the fewest since December 2020, when there were net job losses. But the unemployment rate fell to 3.6%, within the 3.4%–3.7% range that has prevailed since March 2022. Wage growth remained strong—average hourly earnings were up 4.4% year-over-year in June—as the demand for workers continues to outstrip labor supply. We believe that gives Fed policymakers impetus to raise their target for short-term interest rates by 25 basis points (0.25 percentage point) on July 26.
At its last monetary policy meeting, on June 14, the Federal Open Market Committee voted to pause its interest rate hiking cycle, holding its rate target to a range of 5%–5.25%. In its “dot plot,” an aggregation of Fed officials’ individual views, the Fed suggested its rate target would be 5.5%–5.75% by year-end. That’s 25 basis points above our 5.25%–5.5% forecast range.
China
Official data released on July 17 put an exclamation point on China’s relatively weak economic performance. Gross domestic product (GDP) grew 6.3% in the second quarter compared with a year earlier, but that was a percentage point below analysts’ consensus estimate. Although growth topped the first quarter’s 4.5% pace, it owed in large part to favorable year-earlier comparisons. More telling: Compared with the first quarter, GDP grew just 0.8%.
We recently lowered our full-year growth forecast to a range of 5.5%–6%. Uncertainties around meaningful policy stimulus pose a downside risk not only to our forecast but also to the government growth target of “around 5%.” Developments at the Politburo meeting scheduled for the end of July will say a lot about the potential for further downside.
“We anticipate further stimulus measures to remain relatively modest,” said Grant Feng, a Vanguard senior economist. “That could take the form of expanded policy bank financing for high-end manufacturing and the green sector, a modest policy rate cut of 10 to 20 basis points, and further relaxation of housing purchase restrictions.”
Consumer prices fell for a third consecutive month in June and were flat compared with a year earlier. Producer prices, meanwhile, were down by a greater-than-expected 5% year-over-year in June. We foresee full-year headline inflation in a range of 1%–1.5% and core inflation, which excludes food and energy prices, of 1%.
Euro area
Weak recent data, especially from Germany, the euro area’s largest economy, suggest that a recession continued between April and June, marking a third consecutive quarterly contraction.
“Weakness in the euro area has been broad-based across manufacturing and services,” said Shaan Raithatha, a Vanguard senior economist. “That’s consistent with another mild quarterly contraction in GDP, which would extend the recession.”
We expect the peak impact of monetary policy tightening to take hold in the second half of 2023, with the labor market weakening in the European Central Bank’s (ECB’s) continuing quest to bring inflation to its 2% target. We continue to anticipate full-year economic growth of 0.5%, though risks are now skewed to the downside.
The pace of both headline and core inflation, which excludes energy, food, alcohol, and tobacco prices, stood at 5.5% on a year-over-year basis in June. We believe that still-too-high inflation will lead the ECB to raise its deposit facility rate by a further 25–50 basis points to a peak of 3.75%–4%, with no rate cuts until mid-2024.
United Kingdom
A day after government data showed an unexpected rise in core inflation, the Bank of England (BOE) on June 22 announced a 50-basis-point (0.5 percentage point) increase in the bank rate, to 5%. We recently raised our forecast for the BOE’s peak rate by 75 basis points to a range of 5.5%–5.75%, given the stronger-than-expected inflation data, a continued tight labor market, and accelerating wage growth. We maintain our view that the BOE will not lower its rate target until mid-2024 at the earliest.
“The U.K. has had the worst of both worlds when it comes to inflation,” said Shaan Raithatha, a Vanguard senior economist. “Its labor market has faced challenges like those in the United States, with lingering COVID-related supply issues, and its energy-price shock has been worse than in the euro area, given domestic price-setting mechanisms. That’s why the Bank of England still has work to do to get inflation down toward target.”
We expect year-over-year core inflation, which excludes food and energy prices, to end the year at around 4.9% and to average 5.3% in the fourth quarter, still well above the BOE’s 2% target.
We foresee zero economic growth for the full year. Our base case is for recession in 2023, though the likelihood has increased that recession may be delayed into 2024. Resilience is partly attributable to changes in the U.K. mortgage market since the 2008 global financial crisis. Fewer households hold mortgages today, and among those that do, more have rates that are fixed for 2 or 5 years rather than variable. As such, higher interest rates take longer to affect households.
Emerging markets
Emerging markets led the global rate-hiking cycle. As tighter monetary policy conditions cause economies to slow and help inflation recede toward central bank targets, we expect emerging markets to lead the rate-cutting cycle as well. That development could play out this month in Chile, where minutes of the June meeting of Banco Central Chile indicate the possibility of multiple rate cuts this year.
“Chile’s central bank is likely to be the first in Latin America to cut rates,” said Vytas Maciulis, a Vanguard economist. “Inflation, though still high, has fallen consistently, inflation expectations have dropped to the bank’s 3% target, and the broad economy has faltered.”
The Bank of Mexico left the target for its overnight interbank rate unchanged at 11.25% in June. The rate target remains more than 7 percentage points higher than where it stood when the bank’s hiking cycle began in June 2021. We believe the bank is likely to have reached its rate peak but don’t anticipate rate cuts in 2023.
We anticipate global emerging markets growth of 3.9% in 2023, but the recent economic developments in China, the world’s second-largest economy, bear watching. We foresee emerging Asia leading the way with 2023 growth of around 5.25%. We anticipate growth of about 1.5% in Latin America and of around 1% in central Europe, the Middle East, and Africa.
Canada
When the Bank of Canada (BOC) raised its overnight rate target to 5.0% on July 12, it cited a familiar theme: “The accumulation of evidence that excess demand and elevated core inflation are both proving more persistent.” Since the start of its hiking cycle in March 2022, the BOC has raised its overnight rate target by 4.75 percentage points.
We believe the BOC has reached its peak rate target, though risks skew to the upside. “Of particular note is the role of immigration within the labor and housing markets,” said Asawari Sathe, a Vanguard senior economist. “The immigrant share of the population is at its highest level in decades, and that’s keeping both labor supply and housing demand strong.”
The Canadian economy created 60,000 jobs in June, three times expectations and the most since January 2023. Even as the employment rate rose, so did the unemployment rate, to 5.4%, as more people sought work. We expect unemployment to edge up to about 5.5% by year-end as monetary policy slows the economy.
We expect inflation (+2.8% at the headline level, year-over-year, in June but +3.6% excluding food and energy) to continue to moderate this year. Upside risks remain, however, in part because shelter costs remain high in a home loan market dominated by variable-rate and short-term fixed-rate loans.
We continue to foresee 2023 economic growth of less than 1%, with risks to the downside, and a recession late in the year as the effects of higher interest rates spread.
Vanguard’s outlook for financial markets
Our forecasts are derived from a May 31, 2023, running of the Vanguard Capital Markets Model®. Figures are based on a 2-point range around the 50th percentile of the distribution of return outcomes for equities and a 1-point range around the 50th percentile for fixed income.
Following are our 10-year annualised return forecasts. Forecasts are from the perspective of local investors in local currencies.
Australian stocks: 4.3% to 6.3%; ex-Australia stocks: 5.0% to 7.0%.
Australian bonds: 3.4% to 4.4%; ex-Australia bonds: 3.6% to 4.6% when hedged in Australian dollars.
About the Vanguard Capital Markets Model
IMPORTANT: The projections and other information generated by the Vanguard Capital Markets Model regarding the likelihood of various investment outcomes are hypothetical in nature, do not reflect actual investment results, and are not guarantees of future results. VCMM results will vary with each use and over time.
The VCMM projections are based on a statistical analysis of historical data. Future returns may behave differently from the historical patterns captured in the VCMM. More important, the VCMM may be underestimating extreme negative scenarios unobserved in the historical period on which the model estimation is based.
The Vanguard Capital Markets Model® is a proprietary financial simulation tool developed and maintained by Vanguard’s Investment Strategy Group. The model forecasts distributions of future returns for a wide array of broad asset classes. Those asset classes include U.S. and international equity markets, several maturities of the U.S. Treasury and corporate fixed income markets, international fixed income markets, U.S. money markets, commodities, and certain alternative investment strategies. The theoretical and empirical foundation for the Vanguard Capital Markets Model is that the returns of various asset classes reflect the compensation investors require for bearing different types of systematic risk (beta). At the core of the model are estimates of the dynamic statistical relationship between risk factors and asset returns, obtained from statistical analysis based on available monthly financial and economic data. Using a system of estimated equations, the model then applies a Monte Carlo simulation method to project the estimated interrelationships among risk factors and asset classes as well as uncertainty and randomness over time. The model generates a large set of simulated outcomes for each asset class over several time horizons. Forecasts are obtained by computing measures of central tendency in these simulations. Results produced by the tool will vary with each use and over time.
The primary value of the VCMM is in its application to analysing potential client portfolios. VCMM asset-class forecasts—comprising distributions of expected returns, volatilities, and correlations—are key to the evaluation of potential downside risks, various risk–return trade-offs, and the diversification benefits of various asset classes. Although central tendencies are generated in any return distribution, Vanguard stresses that focusing on the full range of potential outcomes for the assets considered, such as the data presented in this paper, is the most effective way to use VCMM output.
The VCMM seeks to represent the uncertainty in the forecast by generating a wide range of potential outcomes. It is important to recognise that the VCMM does not impose “normality” on the return distributions, but rather is influenced by the so-called fat tails and skewness in the empirical distribution of modeled asset-class returns. Within the range of outcomes, individual experiences can be quite different, underscoring the varied nature of potential future paths. Indeed, this is a key reason why we approach asset-return outlooks in a distributional framework.
Indexes used in Vanguard Capital Markets Model simulations
The long-term returns of our hypothetical portfolios are based on data for the appropriate market indexes as of December 31, 2021; December 31, 2022; and May 31, 2023. We chose these benchmarks to provide the most complete history possible, and we apportioned the global allocations to align with Vanguard’s guidance in constructing diversified portfolios. Asset classes and their representative forecast indexes are as follows:
Vanguard
www.vanguard.com.au