
The following animated chart covers the period from 1950 to 2017. It is fascinating to see how the world changes over time.
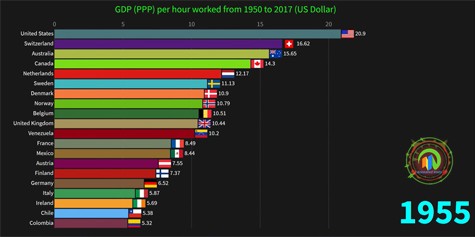
The following animated chart covers the period from 1950 to 2017. It is fascinating to see how the world changes over time.
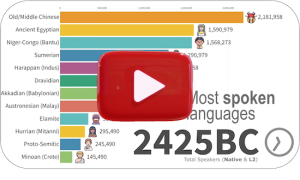
Check out the evolution of the world's most spoken languages from 2500 BC to 2026

Record SMSF growth driven by AI and digital tools, but admin and compliance challenges persist

Australia’s age pension gifting rules are again under scrutiny as advisers warn that retirees are increasingly making financial gifts that unintentionally trigger Centrelink deprivation assessments, said Janet Manzanero-Caruana, senior technical services manager for MLC.

Our latest forecasts for investment returns and region-by-region economic outlook